Animated Maps
For the visualisation of the spatial and temporal distribution of mines and the granting of mining rights in the Großmontanrevier Falkenstein (Schwaz) and in the area Rattenberg-Brixlegg, geoinformation systems are used to create animated / thematic maps.
Place and pit names found in the historical mining texts are localised and georeferenced as far as the current data situation allows. Georeferenced names can subsequently be accessed via the platform Mining Hub .
The following maps illustrate the developments in the mining areas, which could be extracted from the "Verleihbuch der Rattenberger Bergrichter" (Hs. 37) and the "Schwazer Berglehenbuch" (Hs. 1587).
Verleihbuch der Rattenberger Bergrichter (Hs. 37)
The first map depicts the places mentioned in Hs. 37 and could be georeferenced at the same time. The size of the dots is based on the number of awards given for that place. The colours indicate which right was granted: Mining rights (orange), logging in general (green), logging dedicated to smelting (blue) and Other grants (grey). The map illustrates the intensity of mining activities in the Alpbach Valley around the Silberberg to the Wildschönau.
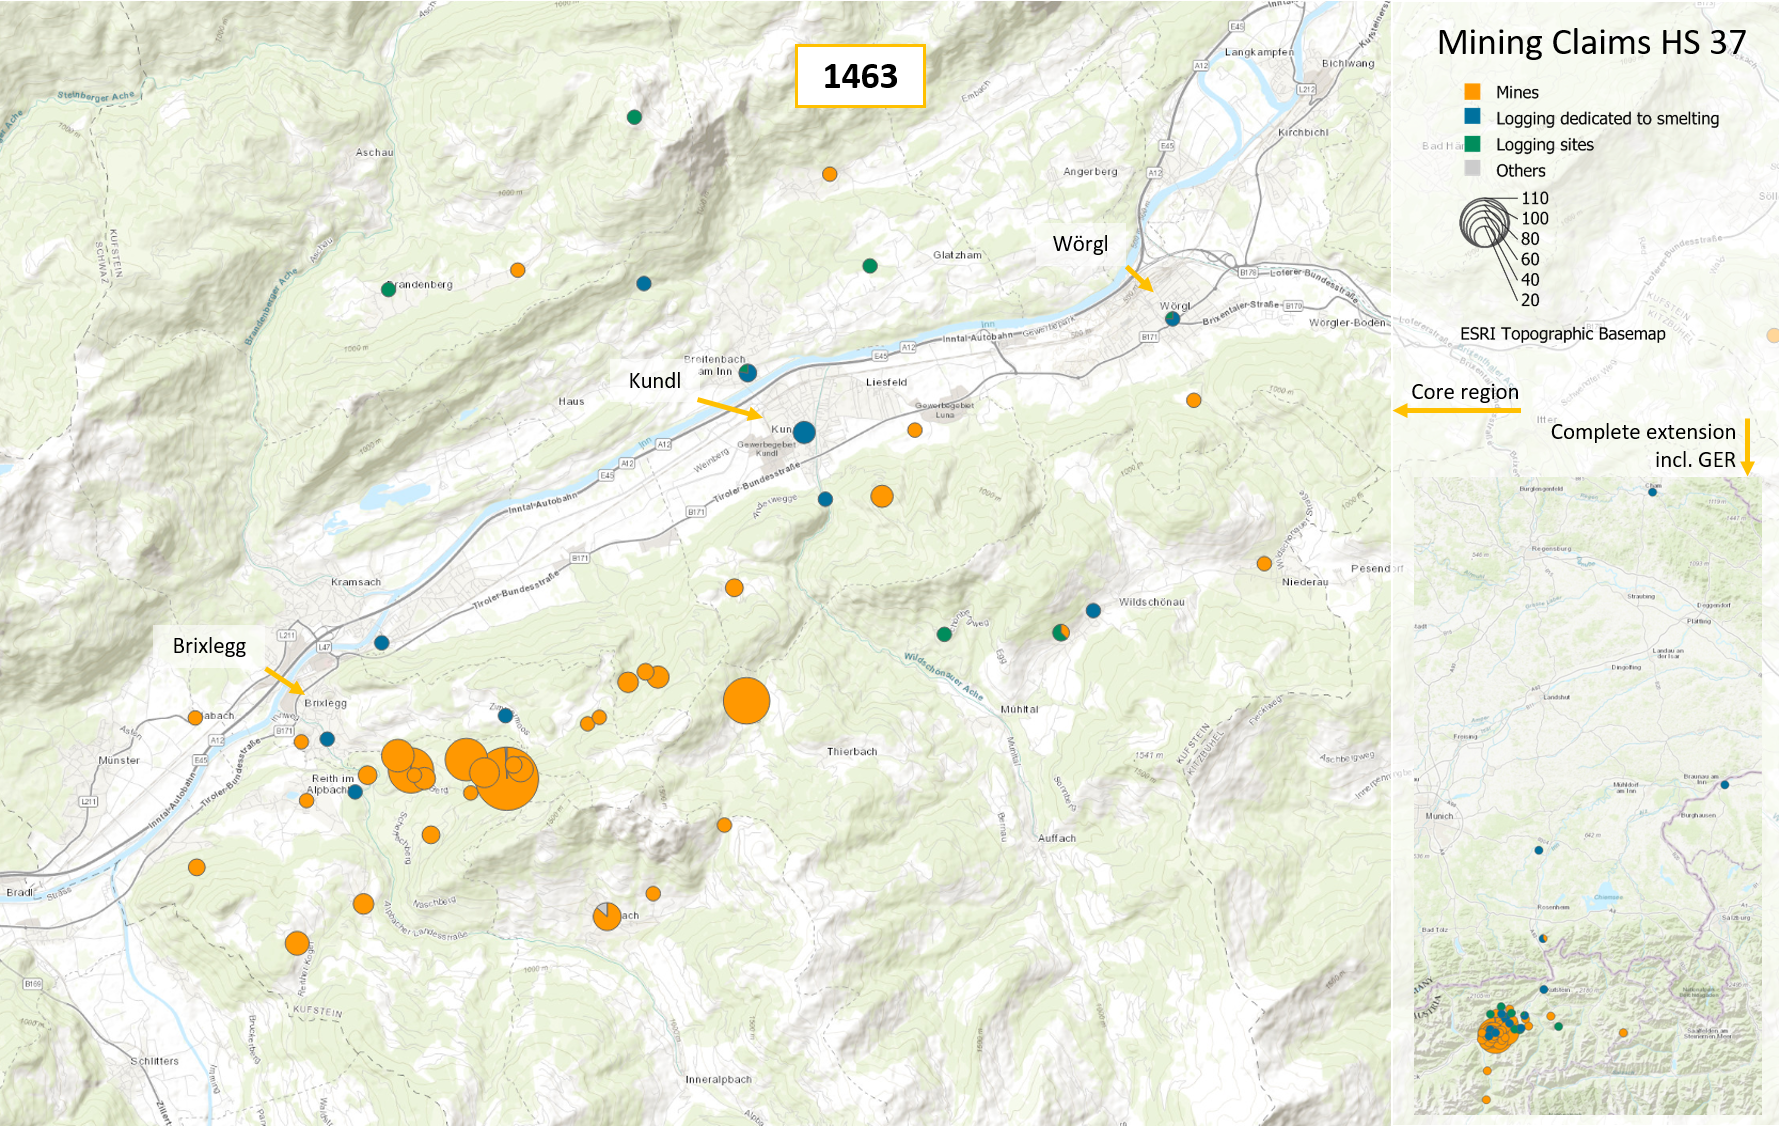
Static map, grants of mines, logging in general, logging dedicated to smelting and other rights in Hs. 37
(c) TMMMT 2022, Brigit Danthine
The animated map illustrate the economic development in the mining areas listed in Hs. 37. While the numbers of grants in the years 1460 and 1461 are still relatively low, from 1462 onwards there is a real mining boom.
Animated map: Development of mining activities in Hs. 37 between 1460 and 1463 (c) TMMMT 2021, Brigit Danthine
Schwazer Berglehenbuch (Hs. 1587)
The following illustrations refer to the information on the mines in the Großmontanrevier Falkenstein in the "Schwazer Berglehenbuch".
The following figure depicts the year 1515 and thus the last year in Hs. 1587. The dots symbolise the mines that could be located, while the size of the dots is in proportion to the number of bestowals. The Sigmund Fürstenbau-Erbstollen (40), which is still known today, is even smaller at this time than, for example, the Silbermühl-Stollen (22), Kron-Stollen (15) and Christoph-Stollen (30).
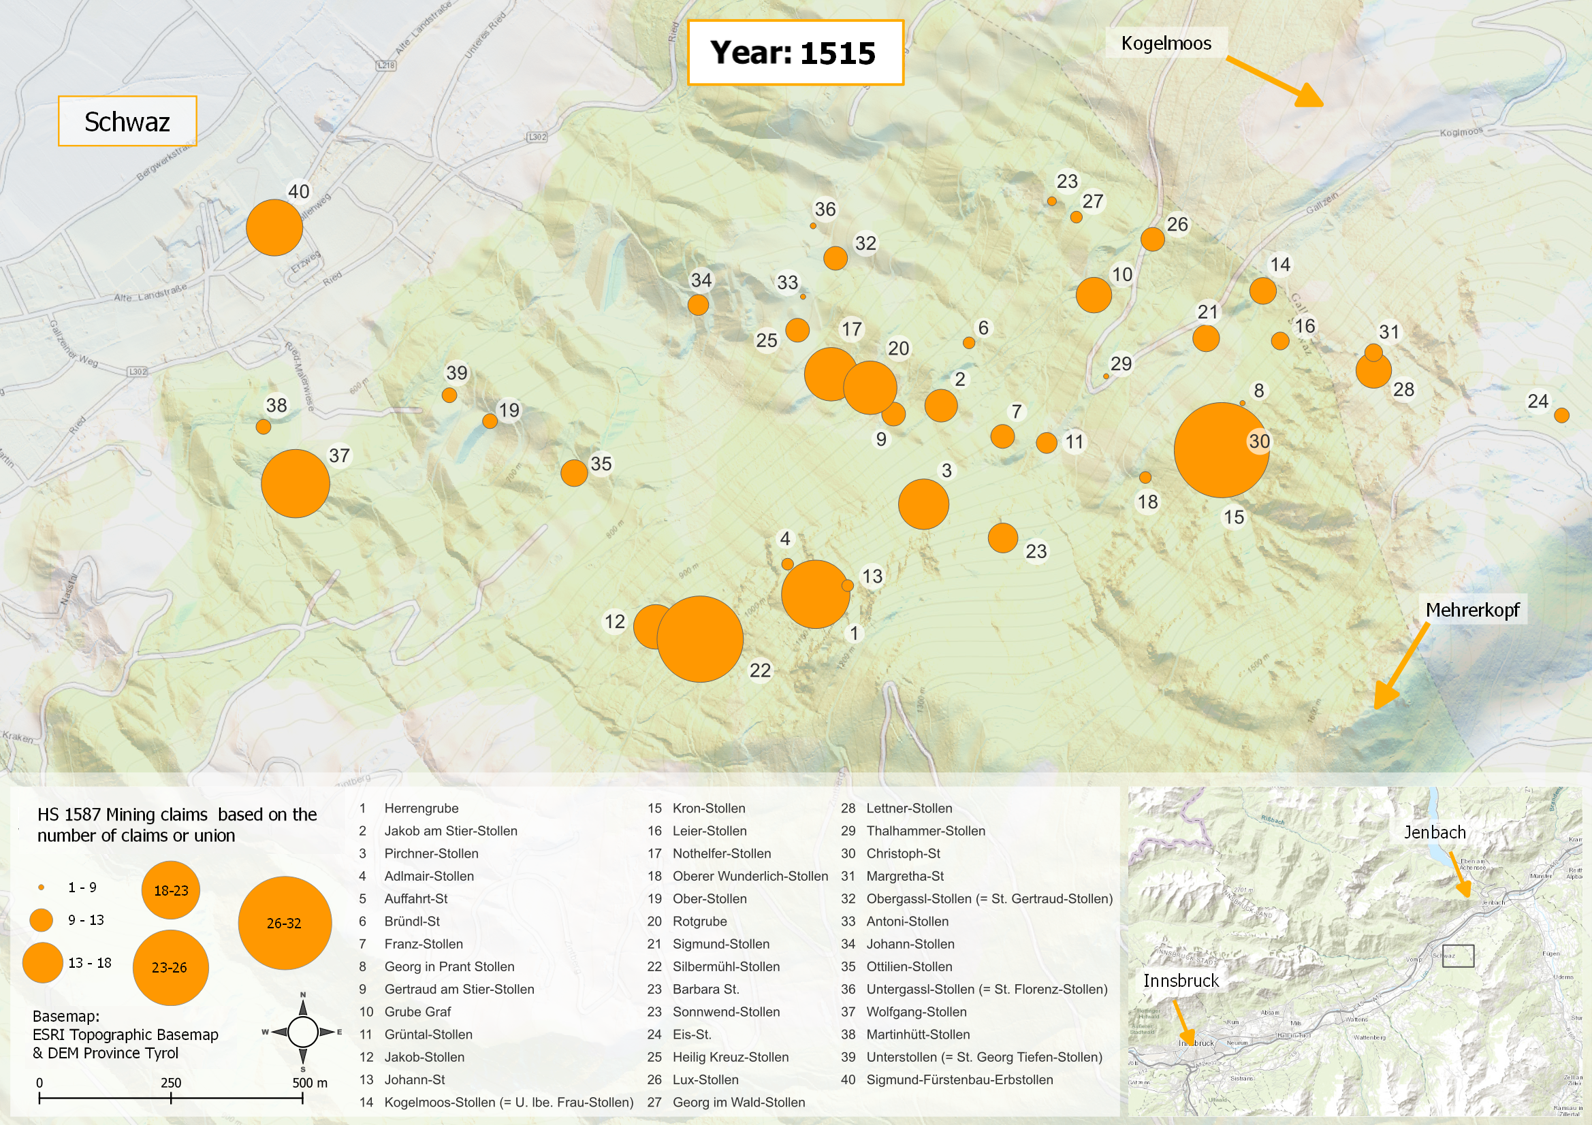
Static map of the historical development of the mines in Hs. 1587 (c) TMMMT 2022, Brigit Danthine
The following animation illustrates the development of the mines in the period between 1441 and 1515, which are mentioned and could be located in Hs. 1587. 5 to 10 year steps were chosen for the animation. The analysis shows that in 1441 only one mining right was granted, namely for the Herrengrube. In the years up to 1460, the number of grants increases only moderately and remains moderate until 1463. A stronger increase in the number of grants can only be seen from 1470 onwards.
Animated map showing the development of the mines in the mining area Falkenstein in the period 1441-1515.
(c) TMMMT 2022, Brigit Danthine
In order to establish the relationships between the places of origin of individuals and the mining areas, ArcGIS Insight was used to create an interactive map .